
I will be giving a talk on Britain’s decision to leave the European Union (EU). After several years of negotiations between the British Government and Brussels, it seems that for now the United Kingdom’s exit will be on 12 April 2019.
How did we get here?
Britain’s relationship with the EU has always been tenuous. Historically speaking, it favored deeper integration of the regional bloc’s common market, but it balked at supporting any policy that would impinge on the United Kingdom’s political, economic or financial sovereignty. Thus, the UK did not join the European Monetary Union, which established the European Central Bank and the euro. It also blocked attempts to strengthen the European Commission’s powers or the European Parliament’s competence in different policy areas.
Over the years, Euro-skeptics in both the Conservative and Labour parties had requested the British Government to renegotiate the UK’s status within the EU. For example, in the 1980s, Margaret Thatcher’s Government negotiated a British reduction to the European Community’s budget, known more commonly as the “UK correction” or the “UK Rebate”.
By 2012, there was a growing number of people in the Conservative and Labour parties, and within the UK’s citizenry, asking for a referendum on Britain’s membership on the EU. While Prime Minister David Cameron agreed that the UK should renegotiate its status within the EU, he opposed holding a national referendum. But, carrying out these negotiations were difficult because Cameron’s Conservatives had formed a coalition Government with the pro-EU Liberal Democratic Party.
In 2015, Britain held parliamentary elections and sensing strong Euro-skeptic sentiments amongst the electorate, Cameron and his Conservative Party promised to hold a referendum on the Britain’s membership in the EU, if his party won a clear majority. Cameron’s decision was in part influenced by the rising influence of the UK Independence Party (UKIP), a fringe right-leaning, anti-EU party.
After winning a majority of the vote, Cameron’s Government started to negotiate new concessions with the EU on multiple issues and it called for a referendum on Britain’s membership in the EU, which was held on 23 June 2016.
Public Opinion Polling and the Results of the Referendum
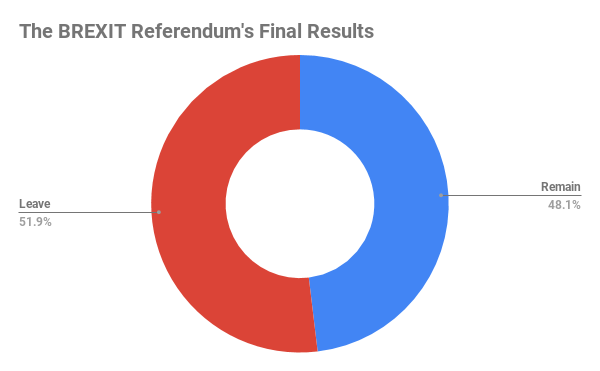
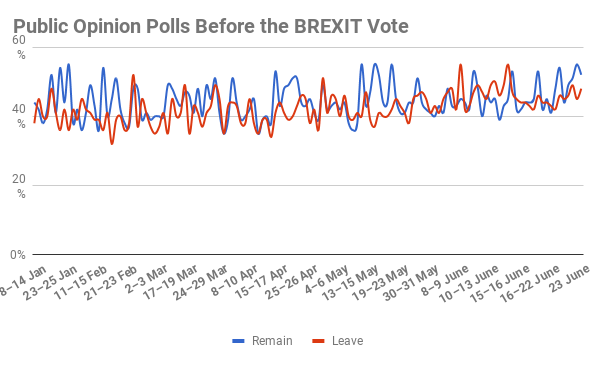
Public opinion data, as can be seen in the following graph, suggested that the Remain Campaign, led by David Cameron and other British politicians, including Theresa May – the current Prime Minister, would win 52% of the vote. The Leave Campaign, which was most associated with the views of the UKIP’s Nigel Farage and the Conservative Party’s Boris Johnson, was projected to win 48%.
The polls did not capture the Leave Campaign’s energy. It won 52% of the vote, while the Remain Campaign captured the remaining 48%.
While the polls failed to forecast British support for the Leave Campaign, by the end of the campaign the pro-BREXIT had been able to mobilize its supporters. To show this, the next graph uses the first graph’s data, but it includes the trendlines for the two campaigns.
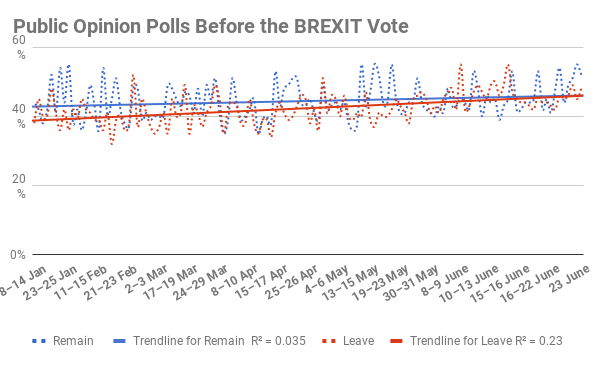
These trendlines clearly show that the race was closer than the final public polling averages suggested.
Today, it is difficult to understand the BREXIT vote’s long-term implications. But breaking down the results of the referendum will help us understand what sort of challenges Britain faces in the near future.
Deconstructing the BREXIT Vote
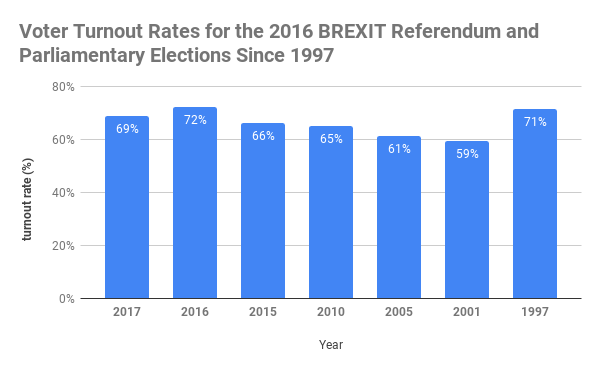
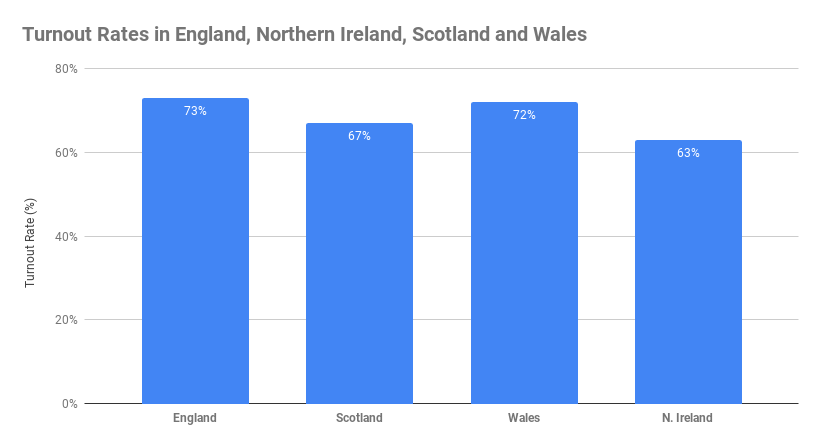
Overall, 72% of the British electorate cast a vote during the referendum. To put this number in perspective, it is worth noting that the rate of participation was higher than any of the parliamentary elections held since 1997.
Let us look first at how electors in the UK’s territorial units (i.e. nations and provinces) voted.
What was voters’ preferences in these territorial units?
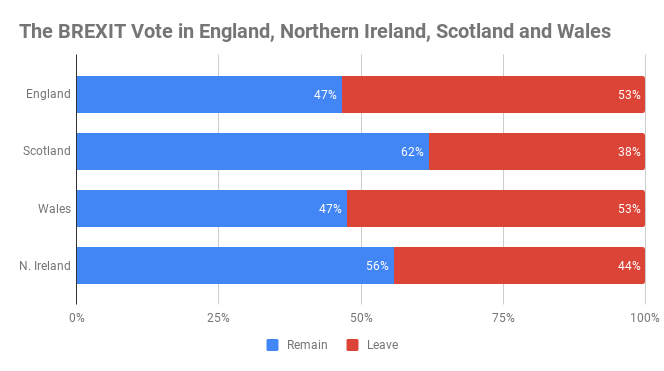
As the bar graph shows the Leave Campaign won a majority of the vote in Wales and England. But it is important to remember that most British citizens live in England. Thus, English voters, more so than voters in the rest of the country, decided Britain’s fate with the EU.
| Remain | Leave | Total Votes | % | ||
| England | 13,266,996 | 15,188,406 | 28,455,402 | 85% | |
| Scotland | 1,661,191 | 1,018,322 | 2,679,513 | 8% | |
| Wales | 772,347 | 854,572 | 1,626,91 | 5% | |
| N. Ireland | 440,707 | 349,442 | 790,149 | 2% | |
| Total | 16,141,241 | 17,410,742 | 33,551,983 | 100% |
Here is a breakdown of the vote by regions.
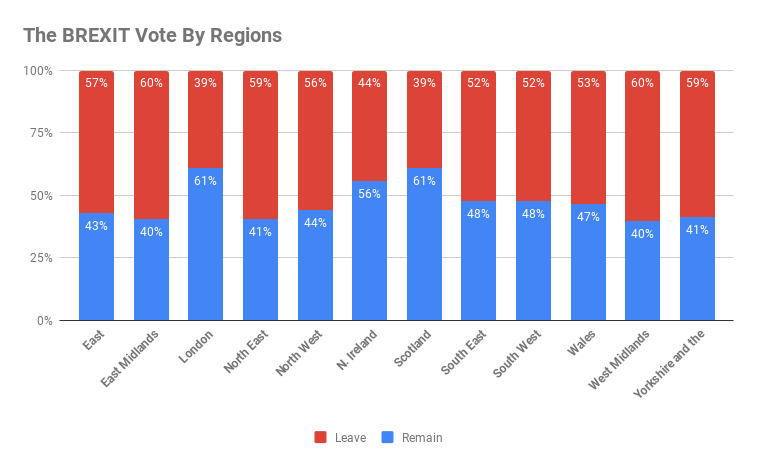
The data shows that while voters in London preferred to remain in the EU that was not the case in rest of England.
Concluding Thoughts
What can we learn about the referendum’s results? Differences between Britain’s territorial units, will foster two problems. First, on Britain exits the EU, we can expect Scottish leaders to call for another independence referendum. One the reasons why the 2014 Scottish referendum failed was Scots’ fear that independence would mean that Scotland would not automatically be part of the EU.
While most voters in Northern Ireland wanted to stay in the EU, the vote was cast along sectarian lines. Thus, 85% of the Catholics/Nationalists voted for the Remain Campaign, while 60% of Protestants/Unionists voted for the Leave Campaign. Many people Brits fear that reestablishing a border to separate the Northern Irish counties from Ireland will reignite the sectarian conflict that ended with the signing of the 1998 Good Friday Peace Agreements. This one of the reasons that Prime Minister May’s Government is trying to find a way to leave the EU but without reestablishing a border.
In part two of the analysis, we will breakdown the 2016 Brexit vote along demographic lines. For now, we can conclude that Britain’s future territorial integrity is in question.